A smarter way to access the private markets
Unlocking the Private Markets For RIAs
Analysis by the Century Park Investment Team
Registered Investment Advisor (RIA) firms are increasingly seeking out investments in the private markets to drive stronger portfolio returns, deepen client relationships, and grow their practices. Despite these potential benefits, investing in private markets often carries more complexity than other more traditional markets like stocks and bonds, presenting operational challenges for RIA firms seeking to expand their platforms.
In our experience, the benefits of allocating capital and resources to the private markets significantly outweigh the costs. Fortunately, as the financial services industry continues to evolve, private markets are becoming more accessible for RIAs seeking to offer them. For firms that don’t yet have the infrastructure to offer these investments in-house, innovative outsourced solutions—like the Century Park platform—are emerging to help firms mitigate many of the most common obstacles and meet client demand efficiently and at scale.
Private Alternatives – A Primer
When building client portfolios, wealth managers have traditionally relied on investments bought and sold on public exchanges, like stocks and bonds. “Private alternatives” refer to private market investments that are not readily accessible in these exchanges. Common examples include private credit, real estate debt and equity, and private equity.
Investing in private alternatives can prove challenging for all but the largest institutional investors, given their higher minimums, expanded sourcing and diligence requirements, and reporting peculiarities. RIAs and advisors will also need to navigate the liquidity restraints of these markets, as investors are often required to stay in their positions for relatively longer periods compared to traditional investments.
Still, allocations to private alternatives have seen remarkable growth in recent years amongst wealth management firms, as shown in the chart below. RIAs that ignore or delay participating in the private markets risk missing out on of the most compelling growth opportunities in the industry.
The Growth in Popularity and Adoption of Private Markets

Private alternatives also represent a significantly wider universe of investment opportunities than public markets. “Given how large and broad they are, and considering the integral role they play in our economy and ecosystem, we believe private markets should be represented in investors’ portfolios just like stocks and bonds,” says Dimitri Krikelas, Chief Investment Officer for Century Park. “If you follow a passive-only investment approach and ignore direct investments in private companies, mission-critical commercial infrastructure assets, or loans that fund small businesses, then you’re no longer investing in ‘the market’.”
Exploring the Benefits and Challenges of Private Alternatives
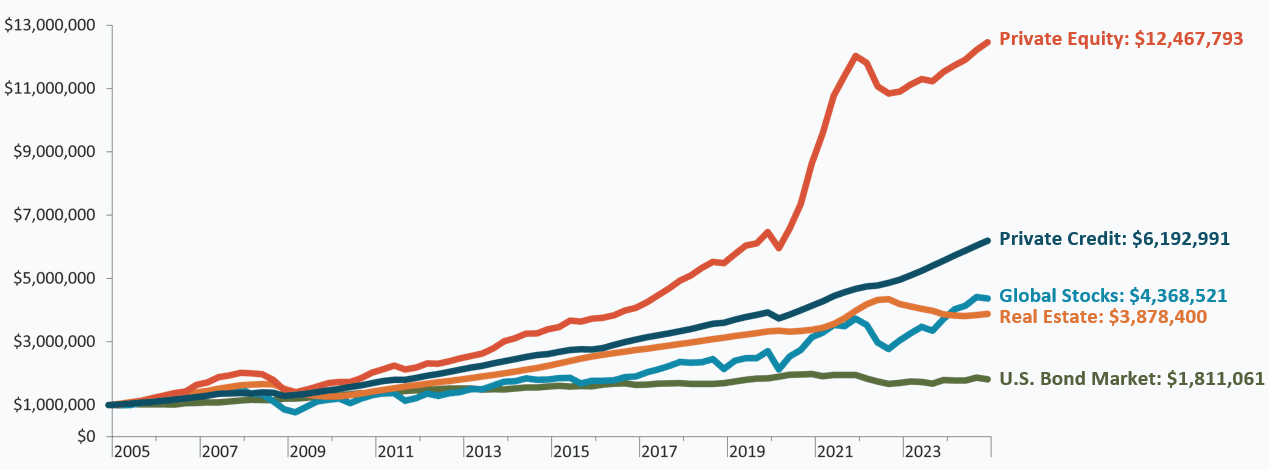
As an asset class, private alternatives are appealing for several reasons. Historically, private asset classes have provided higher returns with less volatility compared to traditional public market investments. Because private assets are not traded on public exchanges, they are not as sensitive to the ups and downs of the broader stock and bond markets. By adding these noncorrelated private investments to portfolios, investors can improve their chances of achieving better returns when public markets underperform, as illustrated in the chart below:
Large institutional investors have known about the advantages of private markets for years, leveraging their size, scale, and infrastructure to find the best deals for their clients. Adoption among RIAs, on the other hand, has been much slower. In 2022, private alternatives only accounted for about 6% of RIA AUM1 , and nearly two-thirds (62%) of advisors say they only allocate between 6%-25% of client portfolios to alternatives.2
For RIAs, common barriers to entry include high investment minimums, long lockup periods, lack of education, compliance, and a vast universe of opportunities to sift through. Given the overall size of the market, RIAs will need to expand their research capabilities and diligence frameworks to identify appropriate opportunities before attempting to add private alternatives to their platforms. Firms will also need adequate staff to fill out subscription documents, process capital calls, manage paperwork, and collect data for reporting purposes. Building out a team and hiring additional staff to fulfill this mandate can be very expensive.
Because of their high minimums and long-term nature (many private, closed-end funds run for eight to 10 or more years without any optionality for liquidity), private assets are especially challenging to allocate individually. Many institutional-grade fund managers require minimum commitments in the range of $1 million to $5 million, rendering them unattainable for many RIA firm clients as well.
Designing an Efficient, Scalable Solution For RIAs
In our view, a successful, long-term private investment program should be able to do more than just “provide access.” Rather, it should be thoughtfully constructed through multiple lenses and feature built-in efficiencies to ensure infrastructure and hiring costs don’t grow at the same pace as firms build scale.
“For RIAs looking to outsource and deliver an alternatives offering to their clients, the best solution should solve for these challenges and reduce the administrative burdens on the advisors,” says Krikelas. “Ideally, the program should serve as a turnkey solution that simplifies the subscription process, minimizes wires and transactions, addresses compliance and diligence concerns, improves transparency and liquidity, and provides consolidated reporting. This is the key to building out an efficient, scalable program for RIAs.”
The Century Park platform was designed with these requirements in mind, providing efficiency, enhanced diligence, and access to seasoned managers in niche categories. Through Century Park, RIAs and their clients can invest in a diversified mix of institutional-quality private funds across a variety of markets and strategies with lower minimums, actively managed exposures, and a shareholder-friendly structure that allows for enhanced transparency and liquidity.
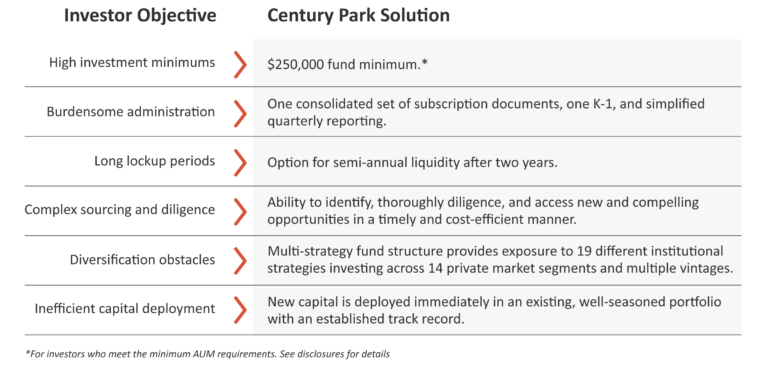
The platform also provides all the research, client education, reporting, and advisor support needed to assist RIA firms in building an efficient and scalable solution for the long haul, as highlighted in the table below:
For RIA firms, accessing private markets through Century Park offers another compelling value-add when it comes to attracting new clients or gaining existing wallet share. Many clients appreciate the added sophistication that private strategy integration brings to their portfolios, and an institutional investment approach can create opportunities for RIAs to deepen their relationships with existing clients.
Offering high-caliber alternative investment opportunities can also help RIAs increase the size of their accounts and assets in a more sustainable way, resulting in improved margins and EBITDA growth, and potentially higher valuation.
Next Steps
Learn more about investing in private markets by calling 310-556-3750 or emailing invest@centuryparkfunds.com.
Citations:
1Fidelity, "2022 RIA Benchmarking Study"
2CAIS-Mercer, "The State of Alternative Investments in Wealth Management 2023"
Disclosures:
This document was prepared by Westmount Partners, LLC (“Westmount”). Westmount is registered as an investment advisor with the U.S. Securities and Exchange Commission and is the sub-advisor for Century Park Funds. The material shown is based in part on information supplied by Westmount and in part upon information obtained from sources it deems to be reliable; however, neither Westmount nor its affiliates shall be deemed to have made any express or implied representations or warranties regarding this material whatsoever, including, without limitation, its accuracy or completeness. Westmount undertakes no obligation to update the contents of this document. It is for information purposes only and should not be used or construed as investment, legal or tax advice, nor as an offer to sell or a solicitation of an offer to buy any security. No part of this document may be copied in any form, by any means, or redistributed, published, circulated, or commercially exploited in any manner without Westmount's prior written consent.
Sources for "Growth of $1 Million" chart: Real Estate (NCREIF) data from 12/31/2004 through 12/31/2024, Private Equity (Cambridge Associates) data from 12/31/2004 through 12/31/2024, Private Credit (Cliffwater Direct Lending Index) data from 12/31/2004 through 12/31/2024. Public Stocks represented by MSCI ACWI Index, Public Bonds represented by Bloomberg US Aggregate Bond Index.
The material contained herein is confidential, and furnished solely for the purpose of considering an investment in The Century Park Growth & Income Fund (herein referred to as “the Fund”). Summaries contained herein of any documents are not intended to be comprehensive statements of the terms of such documents, but rather only outlines of some of the principal provisions contained therein. Westmount shall not be liable for any damages arising out of any inaccuracy in the information. The material herein is subject to change. Each potential investor, by accepting delivery of this presentation, agrees not to use, or make a photocopy or other copy, or to divulge the contents hereof to any person other than a legal, business, investment or tax advisor in connection with obtaining the advice of such person with respect to this offering as to legal, tax, and related matters.
This document is being provided to Qualified Purchasers only and is not approved for use with the general public. The Fund is a private offering pursuant to Regulation D of the Securities Act of 1933 and has not been registered with the Securities and Exchange Commission. Qualified Purchasers who indicate an interest in investing in the Fund will be provided a copy of the Fund's Confidential Offering Memorandum and Subscription Agreement and should thoroughly review these materials before investing. Investing in the Fund is intended for experienced and sophisticated investors only who are willing to bear the high economic risks of the investment and is not suitable for all investors. Investors should carefully review and consider potential risks and perform their own due diligence. Westmount expressly reserves the right, at their sole discretion, to reject any or all expressions of interest or offers to invest in the Fund or any project and/or terminate with any entity at any time with or without notice.
This information is not intended to be legal, tax, business, or financial advice. Please consult with your applicable professional for such advice. If you have any comments or questions about this report, please contact us at info@westmount.com.
Navigating private market performance
Analysis by the Century Park Investment Team
Investors are allocating to private markets like never before. Since 2018, assets under management for private markets have grown by roughly 20 percent, comprising roughly $13.1 trillion as of June 2023.1
While the chief appeal of private investments lies in how they behave, especially relative to traditional assets like publicly traded stocks and bonds, investors must also understand that there are important differences in how these investments are measured.
With traditional investments, portfolio managers rely on widely accepted benchmarks like the S&P 500 and Dow Jones Industrial Average to gauge the relative performance of a given individual stock or fund. Fluctuations may occur throughout the trading day, but at any point in time the underlying stock or fund price is readily available for all to see—no further contextualization is required. Consequently, calculating an individual stock or mutual fund’s return on investment (ROI) becomes a simple arithmetical exercise.
In the private markets, investments are structured and managed differently. Portfolio managers must account for additional factors like irregular cash flows, longer holding periods, and reinvestment windows, making it substantially harder to establish reliable, industry-wide benchmarks to compare performance numbers. For that reason, portfolio managers must rely on alternative metrics that can provide a more comprehensive and accurate picture of how a given private fund is performing and how it’s being managed over time.
Two key metrics—Internal Rate of Return (IRR) and annualized return—are among those preferred by investment professionals when evaluating private investment performance.
Understanding the Essentials
The annualized return metric measures the simple compounded return per year over an investment's life. It converts an investment’s total return into an average annual percentage, making it easier to compare with other investments that have different time horizons. Importantly, the calculation assumes a steady annual growth rate.
Since return streams in such investments are rarely constant, the annualized return helps investors assess performance over time rather than focusing on a single period. For instance, an evergreen fund might return 8% in year 1 and 10% in year 2, resulting in an annualized return of 9% over those two years or a total cumulative return of 18.8%. The annualized figure, when understood, allows for more effective comparison with other investments.
Calculating returns on an annualized basis instead of just looking at total return can help investors better assess the investment's performance relative to a typical yearly return metric—despite periodic fluctuations. That said, it is important to note that while annualized return can provide a practical performance vector, it may oversimplify the return profile of an investment with more complex cash flow timing and sizing.
Another metric, the Internal Rate of Return (IRR), provides a more accurate measure for scenarios with multiple cash flows occurring at varying times and amounts. Calculating IRR requires more precise data, including the date and amount of each cash flow going into or resulting from an investment. This makes this metric more appropriate for evaluating longer-term drawdown funds, which have more complexity around when capital is called and returned.
The IRR metric is useful because it accounts for the time value of money, showing how much an investment will return annually by accounting for the timing and amount of cash flows (as opposed to annualized return, which assumes a steady growth rate and consistent cash flows).
Given that cash flows in more traditional private investments tend to occur at irregular intervals, IRR helps investors better understand an investment’s true return by factoring in when those cash flows occur. However, there are some limitations. Notably, the IRR metric doesn’t account for how much risk was taken, nor does it reflect an investment’s total return. It’s also important to note that IRR only considers invested dollars; uncalled commitments are excluded from the calculation.
Comparing investments across different metrics
Since the IRR metric fluctuates based on the timing of cash flows, it can offer greater detail when cross-comparing other investment outcomes in an investor’s portfolio. For example, if an investment shows significant returns early on, its IRR may skew higher than its annualized return. But if substantial returns are delayed, the IRR may be lower.
“The main takeaway is that the same total return or multiple can be achieved with an annualized return that looks far different than an Internal Rate of Return because the annualized return conveys a simple compounded return, while the IRR factors the timing of those returns,” explains Dimitri Krikelas, Chief Investment Officer for Century Park. “If one investment is projected to achieve a 20% IRR while another is targeting an 11% annualized return, the total returns from both options could generate similar multiples. Investors should be mindful of this when making decisions.”
In this case, the “multiple” mentioned above refers to a third metric—the Multiple on Invested Capital (MOIC)—that is useful for conceptualizing total return and understanding how the annualized return and IRR metrics stack up against each other. The MOIC metric focuses solely on an investment’s total return relative to the initial capital, regardless of when those returns were realized.
For example, if an investor committed $1 million to a project that’s now worth $4 million, the MOIC would be 4x. And in some cases, the MOIC is remarkably similar across two investments where one tracks annualized return and another tracks IRR. Therefore, MOIC can be especially useful for understanding the total return on investment irrespective of time since it focuses solely on the total return relative to the initial capital, regardless of when those returns were realized.
“It’s largely an issue of perception, where the MOIC paves the way for a more actionable comparison across investments,” adds Krikelas. “For example, if you asked a client if they’d prefer an 11% annualized return from an evergreen fund or a 20% IRR on a drawdown fund, they’d likely choose the drawdown fund because 20% is a bigger number. So it’s important to make this distinction because the client could be getting a 2.7x multiple in either scenario, where $1 invested would ultimately yield $2.7 across both investments.”
2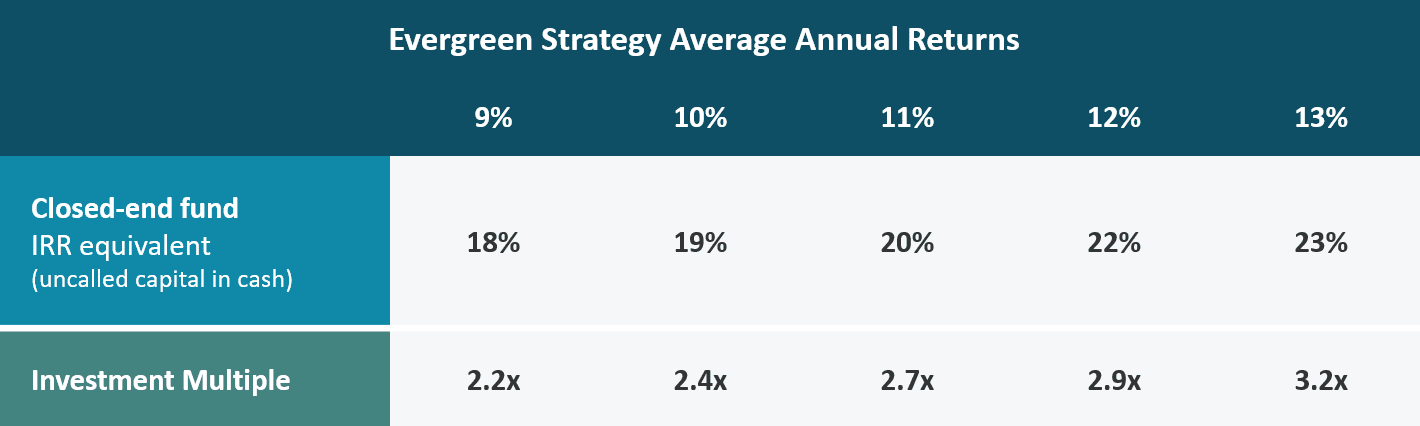
Practical Application
For Century Park, the metrics we use depend on the specific type of investment. For example, we traditionally use IRR to measure the performance of drawdown funds, vehicles that tend to call capital over a two- to five-year period and return capital within a seven- to 10-year window. Since the lifespan of drawdown funds can exceed 10 years, the timing of cash flows is vitally important to understanding performance.
Contrarily, evergreen funds have no fixed end date, allowing investors to make long-term investments in private companies. And because all of the invested capital is immediately invested, the annualized return is a more appropriate and widely used metric in this case.
“If you’re a private markets investor, you need to understand the differences. Otherwise, you might be taking on unnecessarily higher risks or illiquidity for the same results,” Krikelas adds. “For this reason, we favor evergreen vehicles because the funds are invested upfront, and investors can begin to enjoy the benefits of compounding from Day 1.”
| Metric | IRR | Annualized Return |
|---|---|---|
| Pros | • Accounts for the timing and size of cash flows. • Provides a single rate representing overall performance. • Allows for comparison between various investment projects with different cash flow patterns and maturities. | • Allows for straightforward comparisons over different time periods. • Easy to understand and communicate to investors. • Useful for assessing an investment’s long-term performance. |
| Cons | • Can be misleading for investments with unusual cash flow patterns. • The timing of cash flows can affect the outcome. • Calculations may require iterative methods or specialized software. | • Does not account for the timing or size of cash flows. • May not accurately reflect short-term performance fluctuations. |
Taking the Next Step
Private market assets typically carry high investment minimums and require investors to have the right relationships, sourcing channels, and due diligence capabilities. Learn more about investing in private markets by calling 310-556-3750 or emailing invest@centuryparkfunds.com.
Citations:
1Fidelity, "2022 RIA Benchmarking Study"
2CAIS-Mercer, "The State of Alternative Investments in Wealth Management 2023"
Disclosures:
This document was prepared by Westmount Partners, LLC (“Westmount”). Westmount is registered as an investment advisor with the U.S. Securities and Exchange Commission. The material is based in part on information supplied by Westmount and in part upon information obtained from sources it deems to be reliable; however, neither Westmount nor its affiliates shall be deemed to have made any express or implied representations or warranties regarding this material whatsoever, including, without limitation, its accuracy or completeness. Westmount undertakes no obligation to update the contents of this document. It is for information purposes only and should not be used or construed as investment, legal or tax advice, nor as an offer to sell or a solicitation of an offer to buy any security. No part of this document may be copied in any form, by any means, or redistributed, published, circulated, or commercially exploited in any manner without Westmount's prior written consent.
The material contained herein is confidential, and furnished solely for the purpose of considering an investment in The Century Park Growth & Income Fund (herein referred to as “the Fund”). Summaries contained herein of any documents are not intended to be comprehensive statements of the terms of such documents, but rather only outlines of some of the principal provisions contained therein. Westmount shall not be liable for any damages arising out of any inaccuracy in the information. The material herein is subject to change. Each potential investor, by accepting delivery of this presentation, agrees not to use, or make a photocopy or other copy, or to divulge the contents hereof to any person other than a legal, business, investment or tax advisor in connection with obtaining the advice of such person with respect to this offering as to legal, tax, and related matters.
This document is being provided to Qualified Purchasers only and is not approved for use with the general public. The Fund is a private offering pursuant to Regulation D of the Securities Act of 1933 and has not been registered with the Securities and Exchange Commission. Qualified Purchasers who indicate an interest in investing in the Fund will be provided a copy of the Fund's Confidential Offering Memorandum and Subscription Agreement and should thoroughly review these materials before investing. Investing in the Fund is intended for experienced and sophisticated investors only who are willing to bear the high economic risks of the investment and is not suitable for all investors. Investors should carefully review and consider potential risks and perform their own due diligence. Westmount expressly reserves the right, at their sole discretion, to reject any or all expressions of interest or offers to invest in the Fund or any project and/or terminate with any entity at any time with or without notice.
This information is not intended to be legal, tax, business, or financial advice. Please consult with your applicable professional for such advice. If you have any comments or questions about this report, please contact us at info@westmount.com.
Unlocking long-term value:
The strategic advantage of continuation vehicles
The strategic advantage of continuation vehicles
Analysis by the Century Park Investment Team
The main draw of private equity funds is their ability to help investors achieve higher returns, diversify their portfolios, and mitigate risk. But what happens when a high-performing private equity fund reaches the end of its fund term, especially one whose underlying assets still show signs of continued profit potential?
Rather than shutting the fund down wholesale and selling the assets to a third party, the fund’s general partners (GPs) could instead elect to transfer the assets in a specialized secondary structure known as a “continuation vehicle.” These niche funds create potentially favorable scenarios for all stakeholders involved: GPs get to maintain their control over promising assets instead of being ‘forced sellers’ while legacy limited partners (LPs) gain the optionality to cash out after spending 8-10+ years in the fund (as is typical for most PE investments). Meanwhile, it allows potential new LPs to participate in trophy assets well-known to the General Partners.
“Continuation vehicles solve multiple problems,” says Dimitri Krikelas, Century Park's Chief Investment Officer. “They enable General Partners to lengthen the investment duration of companies they've come to know deeply and help create significant value for over the years. By keeping these assets in the hands of experienced management teams and giving them more time to execute their growth strategy, there's potential to unlock even greater value. At the same time, the structure provides liquidity for existing Limited Partners and opens the door for new investors to gain access.”
Benefits to LPs
Because most private equity funds tilt toward illiquidity, continuation vehicles offer an attractive solution for existing LPs looking to realize returns without having to wait out the clock for the asset to sell or go public at a later date. Third-party auditors are routinely consulted to issue fairness-opinion valuations, providing a built-in transparency mechanism and ensuring objective, true market-clearing values and price discovery. Under this kind of structure, LPs can walk away confident in the valuations of their stakes in the investment since the underlying assets are already well-defined. Plus, because the legacy LPs have already been invested in these funds and companies for many years, they are likely to have generated substantial returns and are now ready to realize their long-term investment.
How Continuation Vehicles Stand Out in the Secondary Market
While LP-led transactions of large asset pools chiefly lead the secondary space, continuation vehicles target GP-led investments in trophy assets with the ability to generate long-term value, usually at compelling valuations. For example: 70% of continuation fund deals were completed at a 0-10% discount to NAV in 2022.1 Loss ratios are typically lower, while multiples on capital are generally higher, mainly due to the high caliber of business acumen a company’s management brings to the table.
In most cases, the original fund that spawns a continuation vehicle will have cycled through at least 10 years of operational problem-solving first, where the fund’s underlying company executives have already navigated through the usual logistical growing pains. Consequently, they know which levers to pull to increase growth, cut costs, and meet consumer demand. Rather than cashing out and pocketing profits, the GPs of continuation funds reinvest their profits into the new vehicles. In other words, the structure of a continuation vehicle blends the GP and management team's on-the-ground expertise with the GP’s renewed capital commitment, aligning interests with LPs and instilling investor confidence in return potential.
On the Climb
Although continuation vehicles currently represent just 3-4% of total private equity exits, the asset class has witnessed a surge in demand in the wake of recent liquidity constraints in the private market space. Consider the following:
- According to Pitchbook, global private equity exits to continuation vehicles totaled 89 in 2024—up 7.2% from the previous year and representing $47.3 billion.2
- Continuation funds now represent a record 14% of total sponsor-backed exit volume.3
- More than 80% of the top 100 GPs have participated in the continuation market.4
- Continuation funds outperform buyout funds in each quartile, with less than half the risk (9% loss ratio for continuation funds versus 19% for buyouts).5
“General Partners want to retain their best assets, as they possess unique insight into the value-creation opportunities ahead,” says Krikelas. “Combining the strength of established companies and experienced management teams—backed by years of investment from General Partners—with attractive pricing creates a highly compelling case for continuation vehicles.”
Flexible Participation: Should I Stay or Should I Go?
Legacy LP investors can answer this question for themselves by participating at a level that best aligns with their individual investment objectives and liquidity needs. For example, the investor may be looking for a liquidity event to finance the purchase of a new home or pay for a child’s college education. In some cases, that means cashing out a portion of their holdings while channeling some assets into the new fund. Continuation vehicles give investors the flexibility to tailor their portfolios and access liquidity in alignment with their specific goals.
“LPs receive a tender offer where they get the benefit of access to the new vehicle—partially or wholly—that they wouldn’t get if you were on the outside looking in,” explains Krikelas.
How Century Park Sources CV Opportunities
Century Park accesses this niche asset class by leveraging a longstanding relationship with a premier partner who aggregates multiple continuation vehicles in a single fund. This relationship not only affords investors access to a cadre of underlying businesses, but also the wisdom of multiple management teams who know the risk characteristics and behavioral patterns of each specific asset.
Taking the Next Step
Private market assets typically carry high investment minimums and require investors to have the right relationships, sourcing channels, and due diligence capabilities. To learn more about how we navigate these challenges on our clients’ behalf, call us at 310-556-2502 or visit centuryparkfunds.com.
Citations:
1 https://pitchbook.com/news/articles/gp-led-secondaries-to-end-2024-with-new-record
2 https://pitchbook.com/news/articles/gp-led-secondaries-to-end-2024-with-new-record
3 https://www.torys.com/our-latest-thinking/torys-quarterly/q1-2025/secondaries-in-2025#footnotes
4 https://www.harbourvest.com/insights-news/insights/research-validates-growing-adoption-of-continuation-transactions/
5 https://cdn.hl.com/pdf/2024/2023-continuation-fund-cross-fund-market-insights.pdf
Disclosures:
This document was prepared by Westmount Partners, LLC (“Westmount”). Westmount is registered as an investment advisor with the U.S. Securities and Exchange Commission. The material is based in part on information supplied by Westmount and in part upon information obtained from sources it deems to be reliable; however, neither Westmount nor its affiliates shall be deemed to have made any express or implied representations or warranties regarding this material whatsoever, including, without limitation, its accuracy or completeness. Westmount undertakes no obligation to update the contents of this document. It is for information purposes only and should not be used or construed as investment, legal or tax advice, nor as an offer to sell or a solicitation of an offer to buy any security. No part of this document may be copied in any form, by any means, or redistributed, published, circulated, or commercially exploited in any manner without Westmount's prior written consent.
The material contained herein is confidential, and furnished solely for the purpose of considering an investment in The Century Park Growth & Income Fund (herein referred to as “the Fund”). Summaries contained herein of any documents are not intended to be comprehensive statements of the terms of such documents, but rather only outlines of some of the principal provisions contained therein. Westmount shall not be liable for any damages arising out of any inaccuracy in the information. The material herein is subject to change. Each potential investor, by accepting delivery of this presentation, agrees not to use, or make a photocopy or other copy, or to divulge the contents hereof to any person other than a legal, business, investment or tax advisor in connection with obtaining the advice of such person with respect to this offering as to legal, tax, and related matters.
This document is being provided to Qualified Purchasers only and is not approved for use with the general public. The Fund is a private offering pursuant to Regulation D of the Securities Act of 1933 and has not been registered with the Securities and Exchange Commission. Qualified Purchasers who indicate an interest in investing in the Fund will be provided a copy of the Fund's Confidential Offering Memorandum and Subscription Agreement and should thoroughly review these materials before investing. Investing in the Fund is intended for experienced and sophisticated investors only who are willing to bear the high economic risks of the investment and is not suitable for all investors. Investors should carefully review and consider potential risks and perform their own due diligence. Westmount expressly reserves the right, at their sole discretion, to reject any or all expressions of interest or offers to invest in the Fund or any project and/or terminate with any entity at any time with or without notice.
This information is not intended to be legal, tax, business, or financial advice. Please consult with your applicable professional for such advice. If you have any comments or questions about this report, please contact us at info@westmount.com.